5 bài học từ việc luyện chơi game bằng 4 ngón
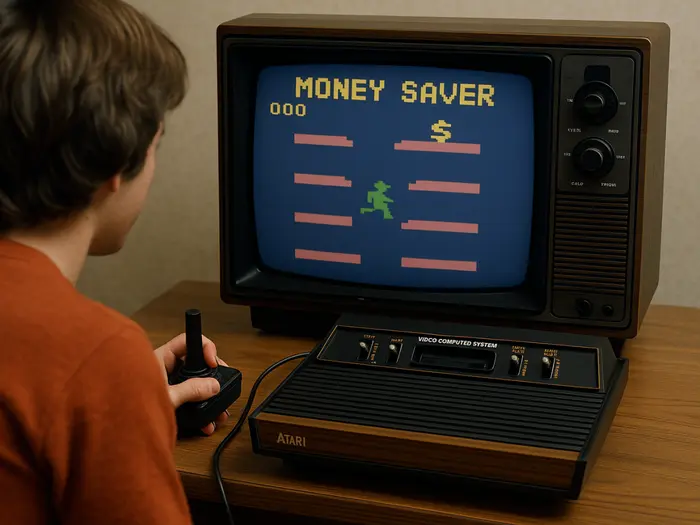
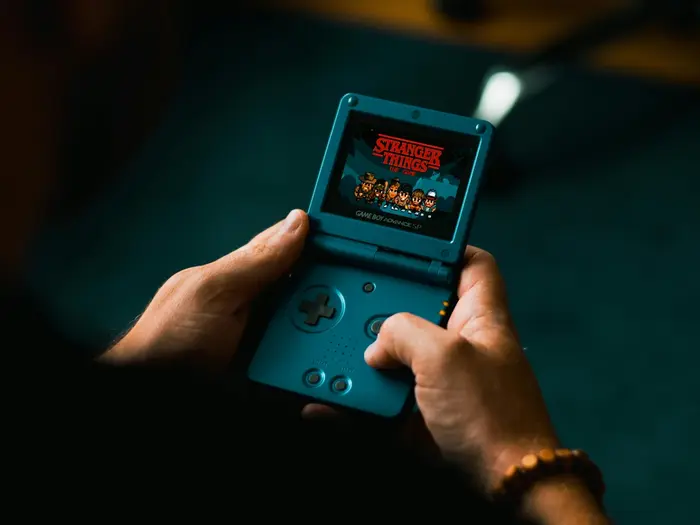
Từ bé tôi đã biết đến chiếc máy thùng chơi game có cần gạt màu xanh hoặc đỏ trông rất giống chiếc đùi gà, bên trái là 5-6 nút bấm sáng đèn rực rỡ. Sống ở nơi tương đối sầm uất nhưng ít khi nhìn thấy quán kiểu như thế này. Tôi còn nhớ thi thoảng đi học về, cứ như có thế lực vô hình nào đó kéo mình vào trong đứng xem người ta chơi gì. Nếu để dành được 1-2 nghìn ăn sáng thì chắc chắn buổi đó không còn đóng vai khán giả. Quá lâu để nhớ hết từng chi tiết, nhưng bị cuốn hút vào trò chơi điện tử là thật. 2008 là năm đầu tiên...
🕝